Live forecasts closer to reported EPS
212 companies, Sep 28 – Nov 6, 2026

Summary
Before a company reports earnings, Wall Street analysts publish forecasts of its earnings per share (EPS). Their average, the Street consensus, is the number the company beats or misses, and its stock moves on the result. AI agents can now build solid financial models. Can they forecast earnings better than the Street by understanding the business?
Over the last six weeks, we had AI agents forecast EPS for 212 companies before they reported their Q3 2026 earnings, using only public information. The agents came closer than the Street on 158 of 212. However, Street estimates tend to run low, so a simple heuristic like raising every Street estimate by 5% would have achieved a similar win rate.
We found that the agents’ edge comes from reasoning about a company’s fundamentals, not just applying a bias. Stronger models research more, build more detailed financial models, and make better forecasts. When agents disagree sharply with the Street, they come out closer 85% of the time, for reasons specific to each company. And when two different models independently predict below the Street, they’re usually right. None of these findings can be explained by simple heuristics.
Together, these results show that frontier AI agents can already understand a business well enough to know when the Street consensus is wrong.
Introduction
The Street consensus is the average of forecasts published by sell-side analysts at banks and brokerages, who write for clients such as hedge funds and mutual funds. Buy-side analysts at those funds make their own forecasts but keep them private. The consensus usually ends up a little low. Of the S&P 500 companies that had reported third-quarter 2026 results by early November, 84% beat it, against a 10-year average of 77% (FactSet 2026).
Companies have reason to keep it low. Over the past five years, S&P 500 stocks fell 3.1% on average around an earnings miss and rose 0.9% around a beat (FactSet 2026). Johnson, Kim and So (2020) find that companies steer investors’ expectations down to levels they can beat. Analysts are rewarded for other things. In a survey of 365 sell-side analysts, forecast accuracy had little direct effect on pay, which depended most on industry knowledge and votes from buy-side clients (Brown, Call, Clement and Sharp 2015).
Even though the consensus is biased low, there has been little evidence that language models can forecast earnings better than analysts. An early claim that GPT-4 could do this was later withdrawn (Kim, Muhn and Nikolaev, 2024), and in EPSBench, the best of six agents only matched the consensus (Yin et al., 2026). In concurrent work, Samaya replayed Q2 2026 earnings for 456 large companies with point-in-time data and found that frontier models beat the consensus, with the newest models also beating a consensus adjusted for each company’s past surprises (Alidoust, Paranjape and Raghu, 2026). We forecast live, before each company reported, and test small companies in the backtest.
We used Shortcut agents to forecast EPS for 212 companies before they reported. The agents came closer than the Street to the reported number on 158 of them (Figure 1). Because the consensus is usually low, a rule that simply raises it would also beat it on most companies.
The more important question is whether the agents were more accurate because they understood something about the business that analysts missed. To answer it, we analyzed how the agents’ predictions differ from simple heuristics.
We also built a backtest, StreetBench, on the 2026 Q2 earnings of 150 small US companies. The agents forecast after the reports came out, but could search only pages saved two trading days before each report. The backtest lets us compare models and harnesses on the same companies, and more of its companies fell short of the Street.
In this post we show how the agents reason over public information to make more accurate forecasts.
Case study: Progressive
Progressive is one of the largest US car insurers, with a 90-year history and a market cap of more than $100B. For Q3 2026, it reported normalized EPS of $4.60. The Street estimate was $4.35, while the agent forecast $4.57, much closer to the reported number. How did the agent get there?
In insurance, the standard measure of profitability is the combined ratio:
Combined ratio = (losses + expenses) / premiums
Losses are insurance claims paid or still to be paid. The combined ratio is central to understanding an insurer’s performance, and a lower ratio means a more profitable company. Progressive publishes its combined ratio every month, which is unusual: most other major insurers, like Allstate, release these metrics only quarterly. So when the agent built its financial model of Progressive, it could use the reported combined ratios for July and August and only had to model September.
The agent spent about 1.5 hours researching and building the financial model from scratch. It analyzed earnings call transcripts from previous quarters, assessed the potential impact of hurricanes and other extreme weather during the quarter, and looked specifically at performance in Florida, Progressive’s largest market.
From this work, the agent estimated a September combined ratio of 90.0, up from 86.8 in July and 89.3 in August. Progressive’s reported September combined ratio was 90.0. The agent’s EPS forecast was close but not exact, because it was still slightly off on other line items.
Better LLM and harness improve earnings prediction
We can test whether reasoning is critical for agents’ accurate predictions by comparing different LLMs. More recent and larger LLMs tend to be smarter and reason better. And they do have better accuracy (Figure 2). Compared to GPT-6 Luna, Claude Opus 5.5 has about 17% smaller error at predicting earnings. For reference, Opus 5.5 is about 40x more expensive than Luna 6 per token.
Agent harness matters too. For the same LLM, using a harness built for financial work (Shortcut) leads to more accurate predictions compared to a coding harness (Codex).
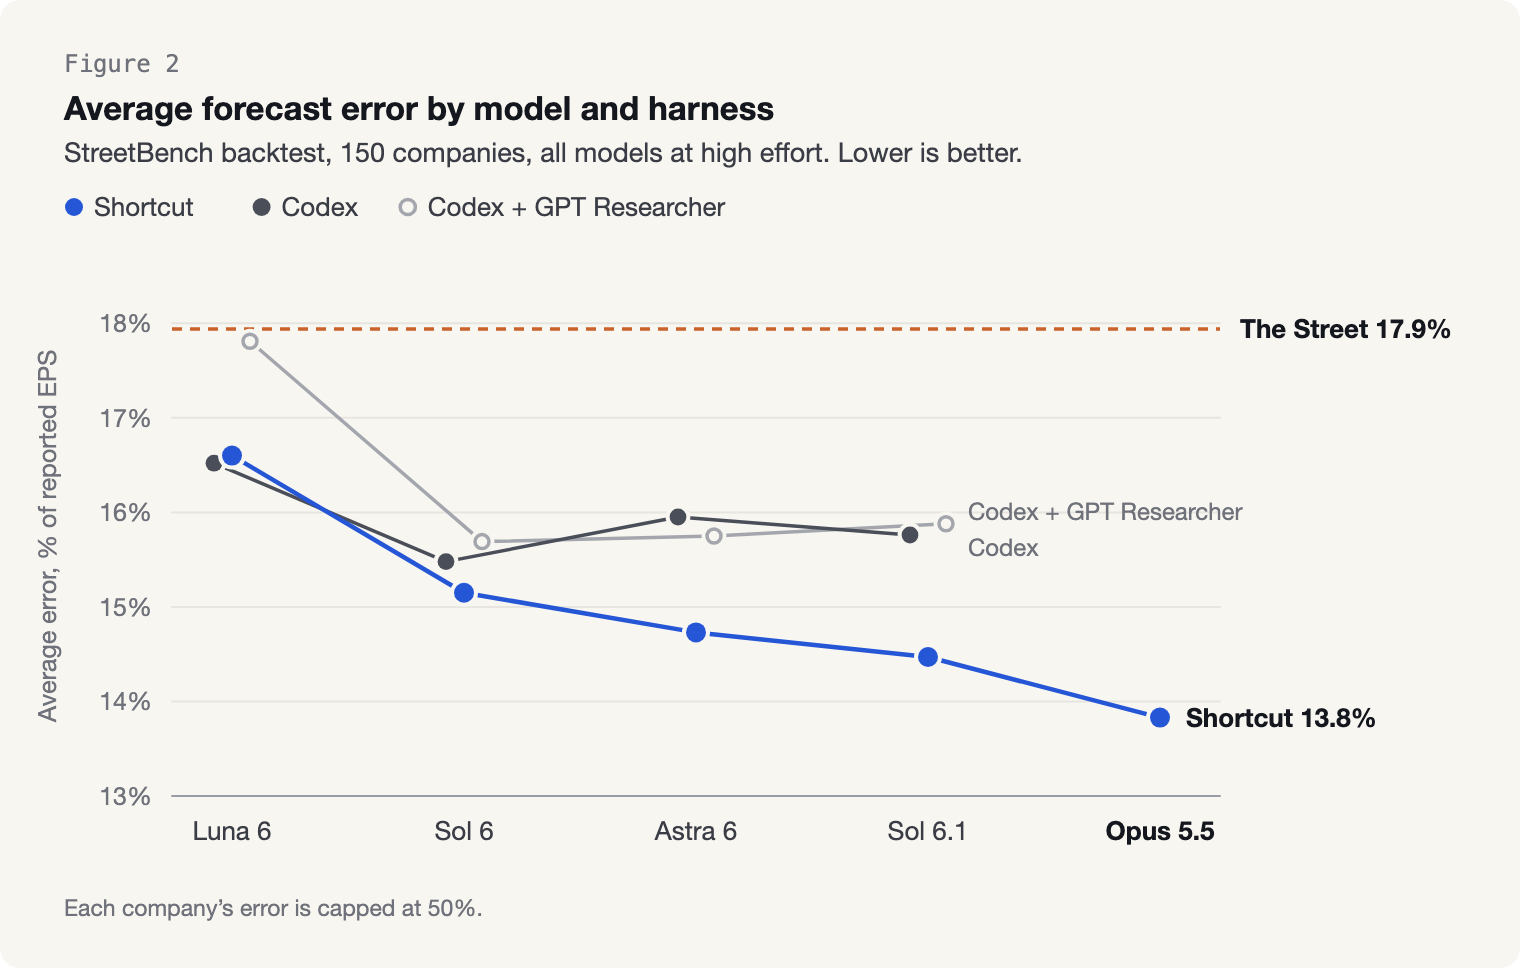
Frontier models are not only smarter, they research deeper and reason over more data. Opus agents typically read 12 pages and cite 15 sources, where Luna agents read 9 and cite 7. Opus agents also build more sophisticated financial models compared to Luna agents (1,640 vs 950 formulas).
Here’s an example of how a stronger model was able to better understand what a piece of news means for earnings.
Pebblebrook Hotel Trust owns more than 40 hotels and has a market cap of around $2.4B. In May, it sold the Chamberlain West Hollywood hotel for $44M. The buyer paid partly in Pebblebrook’s own preferred shares. These preferred shares have a face value of $34M, but both sides agreed to value them at $26M instead, a 23% discount. Preferred shares get their name because their holders get paid a fixed amount before the common shareholders. So getting back the preferred shares at less than face value is good for the common shareholders. Under accounting rules, this doesn’t count as profit, but it does improve Pebblebrook’s earnings per share.
In the StreetBench backtest, Opus was able to work this logic out and adjusted its forecast accordingly. Luna saw the headline about the sale but didn’t even open the article. Pebblebrook ended up reporting an EPS of 17 cents. Opus forecast 16.4 cents, and Luna 9.6 cents. Most of the gap between Opus and Luna is due to this one item.
Agent’s edge comes from its disagreement with the Street
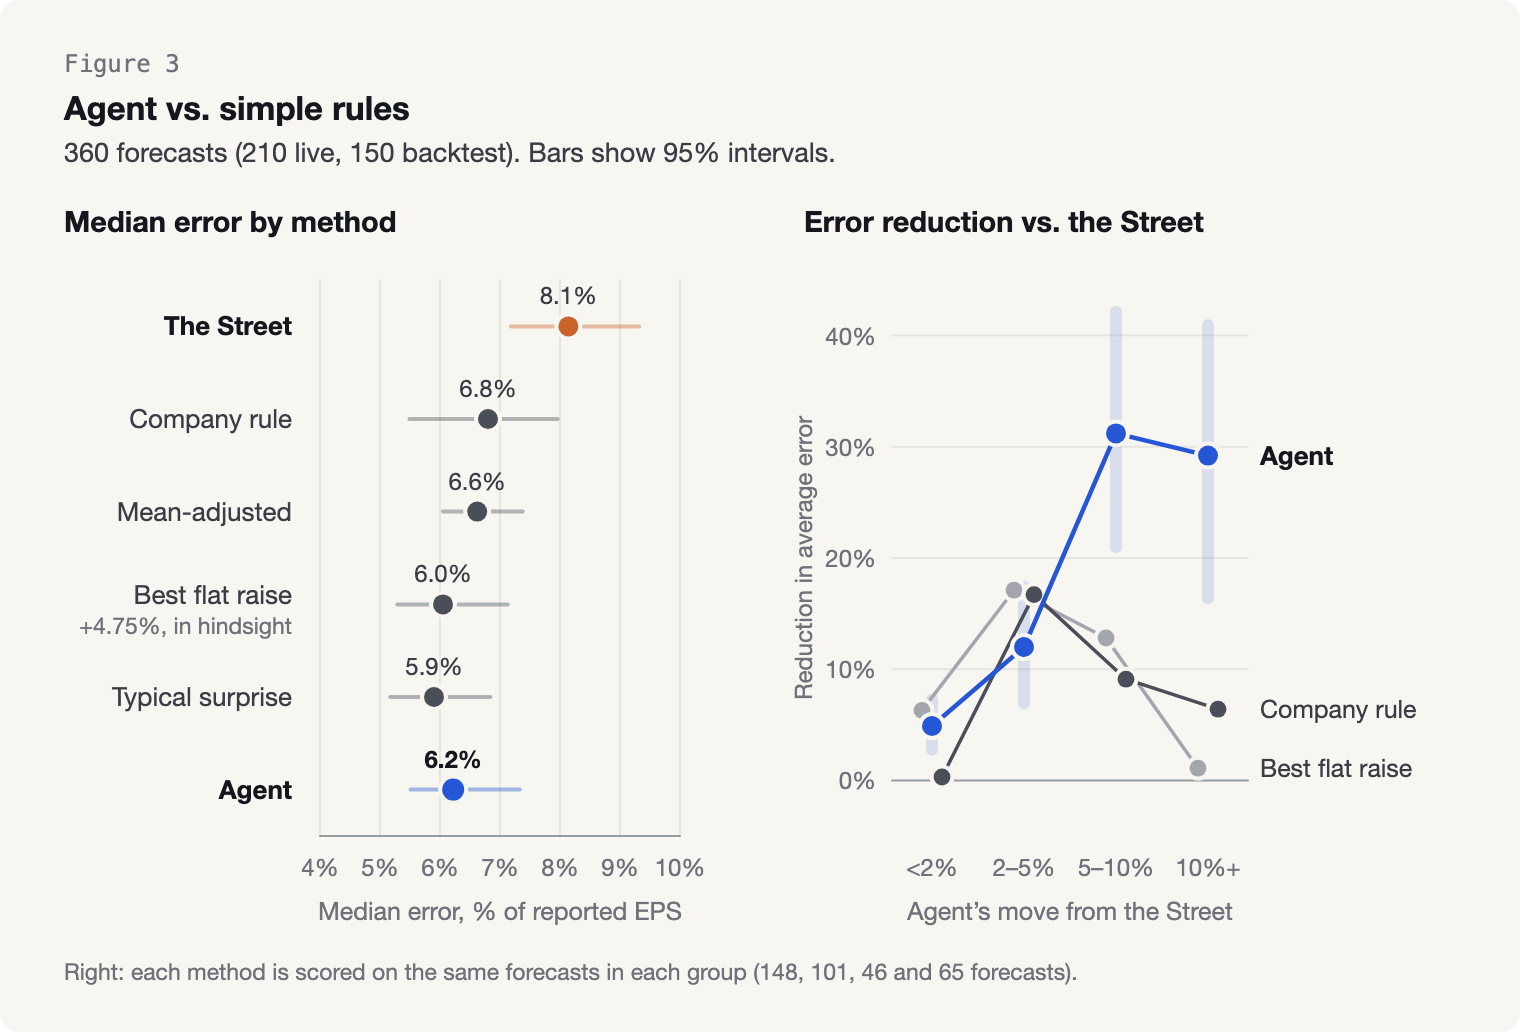
The agent is more accurate than the Street. But since the Street is usually low, that accuracy could come from a simple upward bias with no understanding of the business. In fact, we did remind the agent of this bias in its prompt (Methods). To see if the agent actually understood individual companies, we compare its predictions against several heuristics, including the “flat raise” strategy where we lift all Street estimates by the same percentage.
Across all forecasts, the best flat raise does about as well as the agent. The median EPS forecast error was 8.1% for the Street, 6.2% for the agent, and 6.0% for the best flat raise chosen in hindsight (Figure 3, left).
Despite similar accuracy, the agent’s predictions behave differently from a simple heuristic. In particular, when the agent predictions are most different from the Street (more than 10%), it also cuts the Street’s error the most (near 30%). On those same companies, the flat raise has almost no impact on reducing errors (Figure 3, right).
We then analyzed what drove the biggest disagreements between the agent and the Street (Figure 4). In the 27 live forecasts where the agent’s predictions were farthest from the Street, the agent came out closer on 85% of them. Four were based on the company’s history of beating the Street, the same pattern a flat raise relies on. The other 23 were based on information about the company or its industry, such as monthly results published between earnings reports (like the Progressive example), items below operating profit, and reasons to doubt the Street number. The agent was closer on 19 of these 23. The bias accounts for part of the agent’s overall accuracy, but its large moves away from the Street mostly come from what it found out about each company.
Figure 4
Reasons behind the first 27 big moves
Live forecasts 5% or more from the Street, reported Sep 28 – Oct 29, by the agent’s main reason
Pick a reason, or point at a ticker. Click a ticker to open its run.

Agents are more accurate when they agree with one another
Another way to test whether agents reason about fundamentals is to check whether they’re more accurate when they agree. Two capable agents working from the same public information should often reach the same disagreement with the Street, both forecasting higher or both lower. For example, if a company’s monthly sales are running below what the Street’s estimate implies, any agent that finds those numbers will forecast below the Street. So if the agents reason from evidence, their forecasts should be more accurate when they agree than when they don’t.
Once again, agreement could come from a shared bias. Two agents that both lean above the Street will often agree, and since the Street runs low, they’ll usually be right. But an upward bias like this can’t make two agents agree that a company will miss. So the real test is whether agreement helps when the agents forecast below the Street.
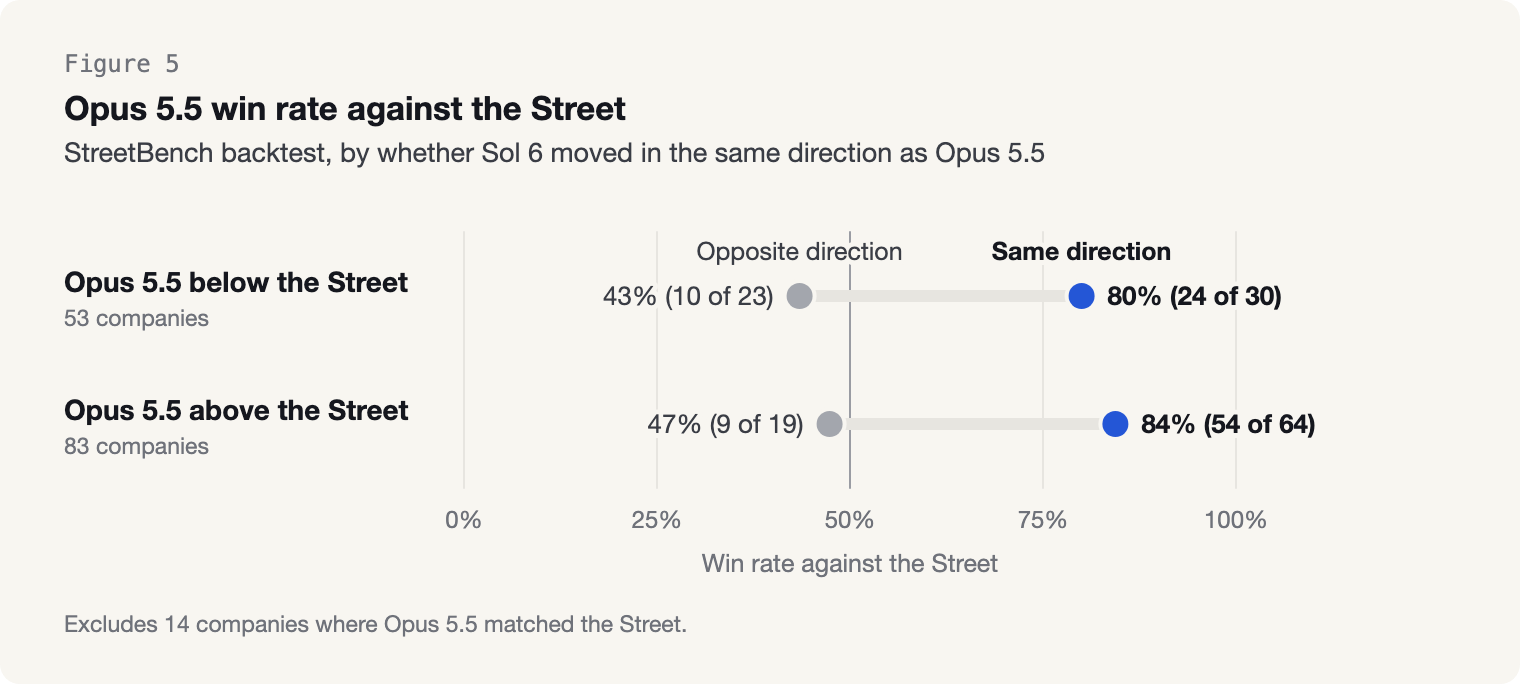
We ran Claude Opus 5.5 and GPT Sol 6 on the 150 companies in the StreetBench backtest, 54 of which fell short of the Street (Figure 5). Opus forecast below the Street for 53 companies. When Sol also forecast below the Street, Opus came closer than the Street on 24 of 30. When Sol didn’t, Opus came closer on only 10 of 23. Agreement also helps above the Street, where Opus came closer on 54 of 64 companies with agreement and on 9 of 19 without.
Conclusion
Forecasting earnings better than the Street consensus doesn’t translate directly into making money in the stock market. But it does test how well an agent understands a business, and on that test the consensus is a serious benchmark. The Street runs a little low, and the buy-side’s whisper numbers are usually more accurate. Still, the sell-side consensus comes from experienced analysts who have management access and channel checks.
Shortcut agents beat it working only from public information, with commercially available models and harnesses. A simple upward adjustment to the Street’s numbers matches their win rate. But their disagreements with the Street mostly come from something specific they found about the company, like Progressive’s monthly combined ratio or the discount on Pebblebrook’s preferred shares.
The reasoning behind these forecasts is easy to follow and usually convincing. Every live forecast is posted in full on Beat the Street (beatthestreet.live).
Methods
We ran two tests. The live test forecast 2026 Q3 earnings before each company reported. The backtest, StreetBench, forecast 2026 Q2 earnings for small companies after they had reported. The backtest let us run many models and harnesses on the same companies, and more of its companies fell short of the Street.
Live test
We forecast EPS for 212 earnings reports issued over six weeks, from September 28 to November 6, 2026. Each week’s companies came from the earnings calendar, and we required at least three analysts behind the Street’s EPS number, with three exceptions. ABB, T-Mobile and Shell each had two analysts on the EPS line we score, though far more analysts follow each company. We kept them because they are large and closely watched. Without them, the record is 157–52.
Each task covered one company and one quarter. The agent received the company’s Street estimates and reported results for the past six quarters, plus the latest Street number. That number was captured at most eight days before the forecast and at least one day before the report. The agent could search the open web through Exa, and it worked in a spreadsheet and in a shell with no internet access. The prompt set an information cutoff and told the agent not to use the company’s actual results if it came across them. The agent researched the quarter, built a financial model in the spreadsheet, and forecast revenue, net income and EPS.
All live forecasts ran in Shortcut at high effort. The 14 reports in the first week used OpenAI’s Sol 6. The other 198, from October 5 onward, used Anthropic’s Opus 5.5. Runs started the weekend before each week’s reports. The information cutoff was set in the prompt, not in the search tool. Every forecast was saved before the company reported and is posted in full on Beat the Street.
For five companies in the last week (Core Scientific, Monster Beverage, Oklo, Simon Property Group and Upstart), reported EPS on our scoring basis took judgment to pin down. We checked each against the company’s filings. Each result is the same on every reading the filings allow.
Backtest
StreetBench uses 200 US companies with market caps of $300 million to $2.5 billion, and their 2026 Q2 reports. We held 50 back for final tests, so every backtest result here, including Figure 2, covers the other 150.
The setup followed the live test, with four differences:
- The agent got five past quarters instead of six.
- It was not given the Street number and had to find an estimate on the web.
- Its search ran through Exa Snapshot, which returns only the copy of each page that Exa had stored by a set date. We set that date to 4 pm New York time, two trading days before each report.
- It used an earlier version of the forecasting instructions. That version starts from a beat rate near 60% and tells the agent to look for a miss. The live version starts from a beat rate based on company size. Both allow a small upward tilt.
We scored each forecast against reported EPS and against the Street’s final number from just before the report, which the agent never saw.
We tested 13 combinations of model and harness, using five models (Luna 6, Sol 6, Astra 6, Sol 6.1 and Opus 5.5, all at high effort) and three harnesses:
- In Shortcut, the model builds a spreadsheet model of the company line by line, guided by written instructions.
- In Codex, OpenAI’s coding agent harness, the model gets the same instructions and returns a single EPS number, with no spreadsheet.
- Codex + GPT Researcher adds a separate research pass before that.
Sol 6.1 and Opus 5.5 ran after the other configurations, on a later Shortcut build.
Keeping the answer out of the backtest
A backtest can leak the answer in two ways: through web pages that already contain the results, and through the model’s training data.
For web pages, we compared four search setups before choosing one. Every setup used the same cutoff instruction in the prompt.
- Open web, prompt only. In all 27 test runs (9 companies, 3 runs each), the agent saw the reported revenue in its search results.
- A date filter on search. We replayed this one rather than running it. It judges pages by their first published date but returns their current text, so 9 of 21 sampled leaks from the open-web runs would still have gotten through.
- Saved copies plus a leak checker. The agent read archived copies of pages, SEC filings, and current pages cleared by Jev, a model from TypeSafe AI that checks for leaks. In a sample, 3 of 149 pages contained a leak.
- Exa Snapshot. In one run we audited, the 7,004 pages with no date showed no confirmed leaks, and 12 could not be resolved.
These numbers count different things, so they aren’t comparable rates. We chose Snapshot because it’s the only setup that never returns a page’s current text, provided Exa’s stored date is correct.
Models can also recall market and economic data from training, even when told not to use it (Lopez-Lira, Tang and Zhu, 2025). So the backtest goes back no further than 2026 Q2, and we score only reports issued after every model’s training data ended. Opus 5.5’s knowledge cutoff is June 2026, so its training data covers the forecast quarter. It could not have seen the results, which came out later, but part of its lead in the backtest may come from this more recent training data.
Scoring
- What we score: normalized diluted EPS, the same basis as the Street number. All scores use unrounded forecasts.
- Forecast error: the gap between a forecast and reported EPS, as a share of reported EPS. We cap it at 50% so that companies earning close to zero don’t dominate the averages. Figure 2 shows the average of this capped error. Medians use the uncapped error.
- Closer: a forecast is closer than the Street when its forecast error is smaller.
- Error reduction: how much smaller a method’s average forecast error is than the Street’s, as a share of the Street’s.
- Ranges: 95% intervals from 2,000 resamples of companies, so that all of a company’s forecasts are drawn together.
- Big move: a forecast 5% or more away from the Street. We chose the 5% line after seeing the results. Core Scientific, whose Street number was $0.00, counts as a big move.
Simple rules
We compared the agent against four rules that adjust the Street number without any knowledge of the quarter. Each rule uses only the past surprises in the history the agent was given: six quarters live and five in the backtest. A past surprise is reported EPS minus the Street number, divided by the absolute value of the Street number, and capped at ±50%. The four rules are:
- Flat raise: raises every Street number by the same percentage. Figure 3 uses +4.75%, the single raise with the lowest average forecast error across all 360 forecasts. We first tested raises of 0.5%, 2%, 5% and 10%. They cut the Street’s average error by 1.5%, 5.1%, 7.2% and −0.6%, so the 10% raise made the average error larger.
- Company rule: adds half of that company’s median past surprise to its Street number.
- Mean-adjusted: raises every Street number by the average past surprise across all companies in that test: 8.5% live and 4.9% in the backtest.
- Typical surprise: raises every Street number by the median past surprise across all companies in that test: 5.9% live and 5.0% in the backtest.
These comparisons cover 360 forecasts: 210 live and the 150 Opus 5.5 backtest forecasts. They leave out SpaceX, which had no past record, and Core Scientific, whose $0.00 Street number a percentage raise can’t move.
Figure 3 (right) groups forecasts by how far the agent moved from the Street. In each group, the agent, the +4.75% raise and the company rule are scored on the same forecasts.
We chose these rules, and the +4.75% raise, after seeing the results. Choosing them in hindsight favors the rules.
Second-model check
For companies forecast by both Opus 5.5 and Sol 6, we checked whether Sol 6 moved away from the Street in the same direction as Opus 5.5. We then counted how often Opus 5.5 came closer than the Street when Sol 6 agreed and when it didn’t, separately for forecasts below and above the Street. Figure 5 shows the backtest.
In the live test, Sol 6 ran as an unpublished second model on the same 72 companies in the weeks of October 5, 12 and 19. In the backtest, both models ran on all 150 companies. We leave out the 14 companies where Opus 5.5’s forecast equaled the Street number, since it made no move. The one Sol 6 forecast that equaled the Street counts as not agreeing.
Data and code
Every live forecast is on Beat the Street. The StreetBench repository has the cases, methods and a scoring script. Company-by-company StreetBench forecasts will stay private until we have confirmed we can share them.
References
- Alidoust, A., Paranjape, A., and Raghu, M. (2026). Frontier AI models outperform human experts on earnings prediction for the first time. Samaya blog, October 8, 2026.
- Brown, L. D., Call, A. C., Clement, M. B., and Sharp, N. Y. (2015). Inside the “Black Box” of Sell-Side Financial Analysts. Journal of Accounting Research 53(1), 1–47.
- FactSet (2026). Earnings Insight, November 6, 2026.
- Johnson, T. L., Kim, J., and So, E. C. (2020). Expectations Management and Stock Returns. The Review of Financial Studies 33(10), 4580–4626.
- Kim, A., Muhn, M., and Nikolaev, V. (2024). Financial Statement Analysis with Large Language Models. Working paper, since withdrawn by the authors.
- Lopez-Lira, A., Tang, Y., and Zhu, M. (2025). The Memorization Problem: Can We Trust LLMs’ Economic Forecasts? SSRN working paper.
- Yin, Y., Xu, C., Ye, L., Peng, J., and Zhang, C. (2026). EPSBench: Benchmarking LLM Agents for Earnings Forecasting. arXiv:2610.38293.
Cite as
Boyko, M., and Yang, R. (2026). Can AI forecast earnings better than Wall Street? Fundamental Research Labs. https://fundamentalresearchlabs.com/research/introducing-beat-the-street
@misc{boyko2026street,
  title = {Can AI forecast earnings better than Wall Street?},
  author = {Boyko, Misha and Yang, Robert},
  year = {2026},
  month = nov,
  publisher = {Fundamental Research Labs},
  url = {https://fundamentalresearchlabs.com/research/introducing-beat-the-street}
}