Figure 1
Sonnet agents beat the equal-weighted portfolio and most technical strategies
Each line is an agent’s return relative to the equal-weighted portfolios. Shading shows the middle 50%, 90%, and 99% of the 7,131 technical strategies adapted from Sullivan, Timmermann, and White (1999) each week. All returns are after trading costs. Agents use Sonnet 5.5 or GPT-6 Luna (high effort) and make trades weekly from Jul 6 to Oct 2, 2026.

Summary
AI agents can now research a company, model its business, and forecast its stock price. But no benchmark reliably measures whether an agent can turn that work into excess returns. Here, we introduce the Catalyst Bench (v0.5). Participants manage portfolios of 320 stocks across 8 sectors, trading weekly for 13 weeks, and are evaluated on their risk-adjusted returns against a baseline. The large number of stocks traded allows the benchmark to separate skill from luck within a single quarter. On this benchmark, we find that (1) agents built on Claude Sonnet 5.5 beat the baseline by 1.2 to 1.4 percentage points over the quarter, and their risk-adjusted returns are better than 99% of random portfolios and nearly all trading rules based on past prices and volume; (2) the same agent systems running a weaker model, GPT-6 Luna, score within the range of random portfolios; and (3) the Sonnet agents can achieve fundamental alpha by researching and modeling catalysts.
Introduction
Fundamental investing
Fundamental equity investors earn excess returns by understanding the value of a business better than the market consensus. They read filings and build models of how a company makes money, analyze public and proprietary data, and hold positions anywhere from weeks to years while the price moves toward their estimate. Trillions of dollars are managed this way, more than $1T through hedge funds (HFR, 2026), and $10T+ through active mutual funds and exchange-traded funds (ETFs) (ICI, 2026).
The skills of fundamental investors are judged on their return against a baseline relative to the risk they take. The baseline is what they would earn without making any active choices, such as a sector index. A standard measure of this risk-adjusted return is the information ratio (IR): the average difference between the portfolio’s return and the baseline’s, divided by how much that difference varies over time (Grinold and Kahn, 2000).
This return above baseline is often loosely called alpha. However, part of that return can be earned by following simple rules. For example, one can hold stocks that are less volatile than the rest. These simple drivers of returns are called factors. Professional investors use alpha more strictly to mean the excess return that remains after removing the factor exposures. Fundamental alpha comes from understanding business fundamentals (in contrast to quantitative alpha for example).
Fundamental investing operates across time scales. On the time scale of years, investors hold a long-term thesis about how the world is evolving, and how that affects a business. On the time scale of weeks and months, they adjust their positions based on new evidence such as quarterly earnings reports, management guidance, policy changes, and news from peers. These events, called catalysts, can move stock prices significantly. Overall, the long-term thesis guides which stocks to own while the catalysts help investors size and time positions. In this work, we focus on the time horizon of several months and assess whether AI agents can generate fundamental alpha by adjusting positions around catalysts.
AI in fundamental investing
LLMs are now widely used to support routine analyst work in fundamental investing (Mercer, 2026). The analytical work agents are doing includes synthesizing financial filings and reports, and building and updating financial models (Opalesque, 2026). Agents are approaching the performance of human experts on these tasks. On one benchmark, the leading agent system achieved a score of 79 out of 100 on research and evidence gathering (Investor’s Last Exam, 2026). On another benchmark, expert graders scored the leading agent only ~6 points out of 100 behind human experts on financial modeling, with the agent working 18x faster (FrontierFinance, 2026).
Beyond routine analyst work, AI-led investment decision-making is beginning to emerge: 5% of asset managers now let AI make recommendations or trades on its own (Mercer, 2026), new hedge funds are launching around AI agents (Bloomberg, 2026), and live-market benchmarks for trading agents are emerging rapidly (e.g. DeepFund; Agent Market Arena; Alpha Arena; LiveTradeBench; AI-Trader).
As agents take on real investment decisions, the need to evaluate them rigorously grows. Fundamental investing is a natural evaluation setting: it manages trillions of dollars, and agents already perform the research and financial modeling it relies on. Yet no existing benchmark systematically evaluates agents on fundamental investing, including catalyst-based investing (see Related Work in the Appendix). Existing benchmarks mostly fall under one of three categories, each with its own limitations: trading/investing benchmarks that have too narrow of a universe and lack statistical power, investor workflow benchmarks that test only workflows of investment professionals, and forecasting benchmarks that don’t test whether the agent can generate returns based on its forecasts.
Benchmark
We introduce Catalyst Bench v0.5 to assess agents’ capabilities for catalyst-based fundamental investment. In short, we ask agents to trade hundreds of stocks across sectors. They trade weekly across a quarter. They are scored by average information ratio against the equal-weighted basket for each sector, and by the IR after removing price factors (see full details in Appendix B).
This benchmark is designed with the following four principles, which give rise to the design choices below:
- Measures fundamental alpha from catalysts. Good performance should come primarily from identifying fundamental catalysts better than what the market is pricing in. Not from price patterns or trading speed.
Agents trade only weekly. Fundamental views take weeks or months to pay off. A weekly cadence gives them time to play out, while still allowing agents to respond to earnings reports. It also rules out high-frequency trading (market making, etc.) and day trading.
- Has enough statistical power. We can’t draw reliable conclusions on agents trading a few stocks over a relatively short time horizon.
Agents trade hundreds of stocks simultaneously to reduce the chance of luck driving the overall returns.
- Can’t leak the future. The agents can’t have access to data more recent than their simulated time.
We give agents access only to point-in-time data, and only test LLMs past the date of their most recent training data (knowledge cutoff date).
- Practical to run. The cost to run this benchmark is proportional to the number of stocks and the duration. This can get expensive quickly.
We chose the number of stocks that’s large enough for statistical power, but not too large that it becomes exceedingly expensive to run.
Here are the specific choices we made for v0.5
| Stocks | 320 US-listed stocks across 8 sectors: machinery, aerospace and defense, hospitality, banks, insurance, real estate trusts, energy utilities, and specialty chemicals. 40 stocks per sector. |
| Portfolio | One portfolio per sector, $1 million paper money each. A participant can short stocks, up to 5% of the portfolio per stock |
| Duration | July 6 to October 2, 2026. For reference, the latest model tested, Claude Sonnet 5.5, has a knowledge cutoff of June 2026. |
| Decision | Every Monday at 3pm New York time, a target weight for all stocks |
| Information | A search tool that serves only what’s public before each trade. |
| Trading | Target weights converted into trades at Monday’s closing price. Trading cost is 0.05% for spread and 0.01% for fee. Borrow cost for short is 0.3% per year. |
| Score | Each sector portfolio’s information ratio against baseline, averaged over the eight desks. The baseline is each sector’s 40 stocks bought in equal amounts at start and then held through. |
| Decided by the participant | Everything else. A single agent, a multi-agent organization, or a fixed price rule can all participate. |
This is a rather straightforward benchmark to build, but it has only become valuable recently for a few reasons. (1) LLMs have only gotten good enough recently to perform end-to-end autonomous fundamental investments. (2) A time-gated search tool has only become commercially available recently (Exa Snapshot). (3) It’s rather expensive to run such benchmarks. 320 stocks x 13 weeks = 4160 decisions can cost thousands of dollars per evaluated model. These kinds of expensive end-to-end benchmarks are becoming increasingly necessary as simpler workflow-based benchmarks grow saturated.
One of the key design choices is the number of stocks traded. We chose 320 stocks to balance statistical power, which favors more stocks, with practical concerns like cost and speed. In Appendix B.4, we show that with 320 stocks across 8 sectors, only 5% of random portfolios reach an information ratio higher than 1.0. Another key decision is the experiment duration. We chose one quarter which is long enough that every company reports earnings once, and short enough to fit after the knowledge cutoff of frontier models. This lets us assess catalyst-based fundamental investing, even though it’s not long enough to validate a view about intrinsic value of a business.
In the Results section, we’ll do more detailed analysis to separate skill from luck.
Results
Agents using Sonnet but not Luna beat the baseline
We evaluated five agent systems on the benchmark varied across agent orchestration, agent harness, and underlying LLMs. We ran a single agent that adjusts its portfolio weekly vs a multi-agent organization consisting of a portfolio manager per sector and an analyst agent per stock. We compared Shortcut, our commercial harness specialized for financial work and Codex, a powerful general harness. And in both harnesses we compared Claude Sonnet 5.5 and GPT-6 Luna. Luna 6 is a much cheaper and weaker LLM than Sonnet 5.5. It is ~20x cheaper than Sonnet 5.5 and its Artificial Analysis Intelligence Index is 28 compared to the 55 of Sonnet 5.5 (higher is more intelligent).
We considered three types of controls: (1) the equal-weighted basket baseline where the portfolio consists of each stock in equal amounts; (2) random portfolios held throughout the 13-week period; and (3) 7000 technical trading strategies (programmatic methods based on historical price, volume, and order flow) adapted from Sullivan, Timmermann, and White (1999). These strategies, which don’t involve fundamental analysis, target daily to weekly time horizons using technical indicators such as moving-average, support-and-resistance, and breakout. Testing the performance of technical strategies helps us understand the relative performance of the agents.
Figure 2
Agents beat most technical strategies on the eight sectors
Each dot is an information ratio relative to the equal-weighted portfolios. Gray dots are 7,131 technical strategies adapted from Sullivan, Timmermann, and White (1999). All returns are after trading costs. Agents use Sonnet 5.5 or GPT-6 Luna (high effort) and make trades weekly from Jul 6 to Oct 2, 2026.

We found that Sonnet agents strongly outperformed Luna agents across agent orchestrations and harnesses. Sonnet agents achieved an annualized IR of 1.4 to 1.6+ compared to Luna’s 0.12 and 0.68 (Figure 2). The Sonnet agents also outperformed 99% of random portfolios (Figure 3) and most technical strategies (Figure 2). We found only modest differences between agent orchestrations and agent harnesses. For example, the multi-agent organization with Shortcut harness performed slightly better in IR among the 3 Sonnet agents, but slightly worse after correcting for price factors (see next section and Figure 5).
Figure 3
Sonnet agents beat more than 99% of random portfolios
Information ratios of 1,000,000 random portfolios per sector relative to the equal-weighted portfolios, with each agent’s score and the share of random portfolios it beats. All returns are after trading costs. Agents use Sonnet 5.5 or GPT-6 Luna (high effort) and make trades weekly from Jul 6 to Oct 2, 2026.

For reference, professional money managers sustaining an information ratio above 0.5 over years is considered good and above 1.0 is exceptional (Grinold and Kahn, 2000). However, there are many differences so we can’t claim Sonnet is an exceptional money manager yet. For example, portfolio managers at institutional hedge funds try to keep their portfolios factor-neutral, we do not impose such requirements on our agent participants.
Next, we will try to understand how Sonnet agents are able to achieve excess returns.
Sonnet’s returns are broad and only partly factor-driven
The first two questions we ask are: (1) did the Sonnet agents get lucky in a few trades? (2) can their trades be explained by combinations of simple factors?
Figure 4
Sonnet agents profited on more stocks than they lost on
Each bar sorts the 320 stocks by whether the agent made or lost money on them relative to the equal-weighted portfolios, before trading costs. Within 1 bp: less than $100 either way on a $1 million portfolio. Agents use Sonnet 5.5 or GPT-6 Luna (high effort) and make trades weekly from Jul 6 to Oct 2, 2026.

To test whether the Sonnet agents achieved returns through a few trades, we measured the profit and loss on every stock for all agents, relative to the baseline. For all stocks with more than 1 basis point of profit or loss, all Sonnet agents consistently profited on more stocks than they lost on. The same is not true for Luna (Figure 4).
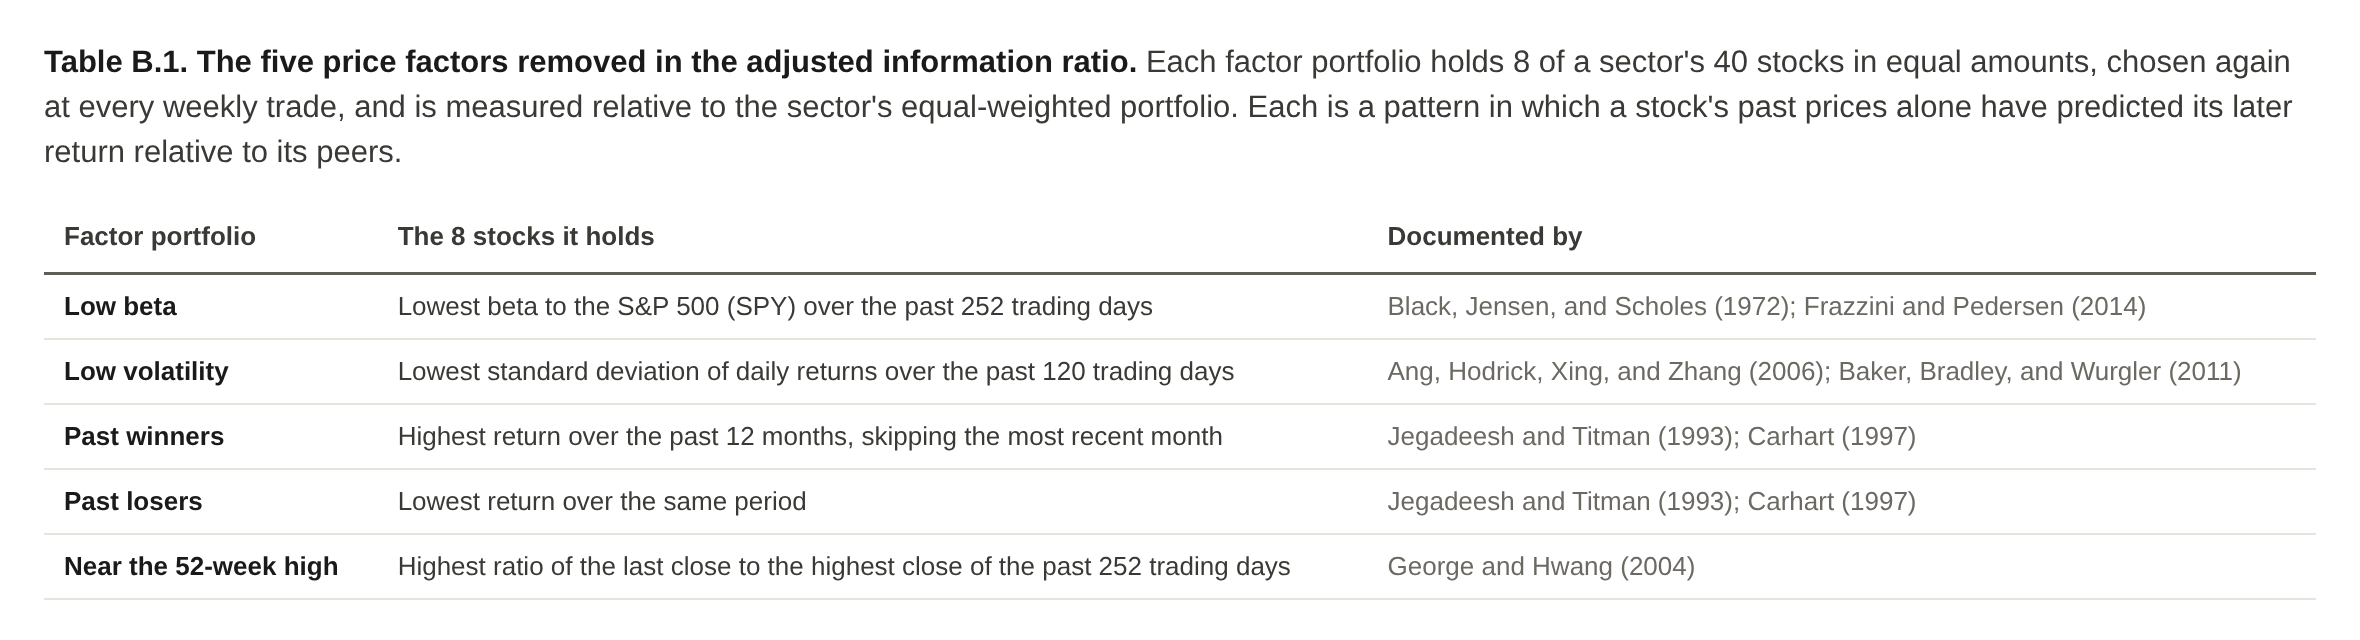
Next we test to what extent the agents’ excess returns are alpha rather than explained by simple price factors. We evaluate excess returns after stripping out exposure to common price factors built from the desk's stock universe: low beta, low volatility, past winners, past losers, and nearness to the 52-week high (Appendix B.1). For each sector s, we regress the agent portfolio’s daily return over the equal-weighted basket on the daily returns of the factors:
where fs,k,t is the return of factor k in sector s on day t, and αs is the alpha: the daily return the factors can’t explain. The adjusted information ratio is αs divided by the volatility of the residual, annualized and averaged over the 8 sectors:
Figure 5
After removing price factors, Sonnet stays near 1 and Luna falls below 0
Each agent’s information ratio relative to the equal-weighted portfolios, as measured and after removing the part explained by five price factors: low beta, low volatility, past winners, past losers, and nearness to the 52-week high. All returns are after trading costs. Agents use Sonnet 5.5 or GPT-6 Luna (high effort) and make trades weekly from Jul 6 to Oct 2, 2026.

Price factors explain more of Luna’s excess returns than Sonnet’s (Figure 5). All 3 Sonnet portfolios keep an adjusted information ratio of around 1, but Luna’s factor-adjusted information ratios fall below zero. So Sonnet agents generated alpha but Luna didn’t.
These results show that Sonnet agents’ excess returns compared to baseline cannot be explained by just a few lucky trades and only partly by simple factors.
Sonnet’s alpha comes from reasoning over business fundamentals
Now we’ll examine whether Sonnet’s alpha comes from fundamental analysis.
Sonnet analysts generally researched more than Luna. For each stock’s initial analysis, Sonnet made 69 requests to our search tool against Luna’s 38. Sonnet cited 26 sources per stock to Luna’s 20.
A comparison on how Sonnet and Luna analyzed Karman Space & Defense shows how better research and reasoning can translate to better investment. Both Sonnet and Luna analysts listed the same weak cash conversion and control problems. Luna read the stock’s recent fall as a “relative-recovery setup” and forecast a gain, while Sonnet found that “about 29% of shares come off lock-up on 2026-07-18” and forecast a loss. Over the next quarter, Karman fell 26% against its sector. Luna’s call is based more simply on the stock’s price history, while Sonnet relied on a fact it found in research.
Here we further illustrate how the profitable trades Sonnet agents made come from fundamental analysis rather than luck. We examine two representative examples:
Case study 1 (Short): Lennox
Lennox makes heating and air-conditioning equipment, mostly for homes. By July 6 its stock had risen 26.5% in three months, mostly in June after a cut in tariffs on HVAC equipment and a rally in homebuilders. However, its first quarter did not support the rally: Lennox’s earnings per share fell 8%, and revenue in Home Comfort, its larger residential segment, fell 10% with margins down 3.9 points. Management nevertheless kept its full-year guidance, and the analyst agent did the math: “Hitting the guide needs roughly $20.90 of EPS over the last three quarters, a steep back-half ramp.” It rated Lennox a small short, forecasting that it would trail the sector by 2.1% over 91 days. Its bear case, given a 30% chance, was that the second quarter would show “residential still down double digits and the stock gives back the June rally”. It also wrote down what would change its mind: a guidance raise at the second quarter, made plausible by the tariff cut.
Each sector portfolio starts as an equal-weighted basket of 40 stocks, so Lennox began at 2.5% of the portfolio. The portfolio manager agent cut it to almost nothing: “run-up on tariff cut with Q1 EPS and margin down; reduced to roughly zero weight”. The week before Lennox’s earnings report, the PM agent took a short of about 2%. On July 29 Lennox beat the quarter’s earnings estimate but cut its full-year EPS guidance to $23.00–24.00, below consensus, and the stock fell about 21% that day while peers Carrier and Trane raised their guidance. By July 31 Lennox was down 27% from early July, against 12% for Carrier and 4% for A. O. Smith. The analyst dropped its short rating (“The short worked”), and the PM closed the short that week. Over the quarter, the position earned $11,027 against the basket.
Case study 2 (Long): Booz Allen Hamilton
Booz Allen Hamilton sells consulting and technology services, mostly to the U.S. federal government. By July 2, its stock had fallen about 21% from early June. The worst day was June 18, when it fell about 7% as the consulting firm Accenture cut its outlook, citing weaker U.S. federal spending. Booz Allen’s own guidance had not changed, and the analyst agent argued the selloff was guilt by association: “The drop looks like a read-through.” At $62.45 the stock traded at about 10 times the midpoint of the company’s own earnings guidance for the year ($6.00–6.35 a share). Free cash flow guidance was $825–925 million, and backlog was a record $38 billion. The agent rated Booz Allen a long, 2.5% above the sector over 91 days, and named the catalyst inside that window: first-quarter results on July 24. Its bear case, given a 25% chance, was “more federal and consulting de-rating, or a guide trim.”
The PM agent made Booz Allen its largest position in the sector, 6.6% of the portfolio. On July 24, Booz Allen reported adjusted earnings of $1.81 a share, up 22% and above the roughly $1.48 analysts expected, with free cash flow of $261 million against $96 million a year earlier. The stock rose 10.1% that day. The analyst kept the long but noted that “the stock has already paid for most of it.” Two weeks later it moved to neutral: “Last week’s edge came from a depressed price, and that is now used up.” The manager cut the position to 1.7%. From July 6 to that cut, Booz Allen rose 22% while its sector fell 0.3%. Over the quarter, Booz Allen earned $6,514 against the basket.
Conclusion
Backtesting fundamental investing has only recently become seriously possible. It needs a system that can do an analyst’s research without help: read filings, search for news, and keep a spreadsheet model current week after week. It also needs a searchable database of what was public at each past date. Each individual workflow has been benchmarked but the performance of the combined system is unclear.
There is much anecdotal evidence now that agents are able to trade and make strong returns. Most of this evidence suffers from small sample size and/or survivor bias. In this work, by assessing agents’ trading performance over one quarter for hundreds of stocks, we report that agents using a strong LLM (Sonnet), but not a weak one (Luna), can generate fundamental alpha by researching and modeling catalysts.
Appendix
A. Related work
Fundamental investing combines three capabilities: research into a business, analysis and modeling of its economics, and forecasting of its future. Trading performance measures the outcome of all three together. Prior work has mostly evaluated each capability in isolation, or has evaluated trading in settings that do not require these capabilities.
A.1 Evaluating capabilities
Previous work has evaluated the following components of fundamental investing largely in isolation from each other:
Research. Early financial QA datasets such as FinQA, TAT-QA, and FinanceBench test reasoning over supplied documents. Recent agentic benchmarks make the research environment more realistic, requiring agents to search filings and the web and synthesize their findings. This includes the Finance Agent Benchmark, FinSearchComp, FinDeepResearch, BigFinanceBench, FinanceGym, FrontierFinance (Zhang et al.), Investor’s Last Exam, and Deep FinResearch Bench. These benchmarks score the answers or reports against references or rubrics by their accuracy and quality. Two also check a call against what happened afterward. Deep FinResearch Bench compares each report’s fair value estimate and recommendation with the stock price three and six months later, and Hedge-Bench gives the agent a frozen set of documents and asks for a research report together with a yes-or-no forecast that resolves against a real outcome.
Analysis and Modeling. FrontierFinance (Krumdick et al.), IB-bench, and Investor’s Last Exam grade financial models using expert-designed tasks. BankerToolBench covers full investment-banking deliverables, graded against rubrics written by bankers, and GAUGE grades agent-built valuation models against observed professional practice. FrontierFinance and GAUGE include human baselines. In most of these, participants must search for and pull relevant findings into their models; GAUGE supplies the financial statements. Outputs are scored against references or rubrics, which can establish that an analysis is well constructed, but not that its conclusions are correct relative to the market.
Forecasting. Forecasting benchmarks score predictions against outcomes that resolve after submission. ForecastBench and FutureX pose questions about future events across many domains, and Prophet Arena draws its events from live prediction markets. In finance, FinDeepForecast asks agents with web search for corporate financial metrics, macroeconomic indicators, and corporate events, PriceSeer asks for the closing prices of 110 US stocks three to ten trading days ahead, and Investor’s Last Exam includes stock price forecasts. In the finance literature, Lopez-Lira and Tang use ChatGPT scores of news headlines to predict daily stock returns; Kim, Muhn, and Nikolaev have GPT-4 predict the direction of earnings from anonymized financial statements; and Papasotiriou et al. have GPT-4 rate stocks from fundamentals, market data, and news and assess the ratings against forward returns. The benchmarks that permit web research directly test agents’ abilities to utilize research in a realistic environment to create a correct forecast. Investor’s Last Exam reports that strong research scores do not carry over to forecast accuracy. A forecast score also does not show whether a participant attains excess returns: a correct forecast earns returns only if stock prices do not already reflect the information behind it and if it is converted into well-sized positions.
A.2 Evaluating trading performance
Trading benchmarks score outcomes directly and test the full loop from gathering information to making trading decisions. Several employ backtesting. InvestorBench trades single assets, including seven stocks, at a daily cadence, with summaries of 10-K and 10-Q filings among the agent’s inputs. FINSABER extends backtests of LLM strategies to more than 100 symbols over two decades and finds that the advantages reported in earlier work shrink at that scale. KTD-Fin controls leakage with stock and date masking, StockBench backtests on curated post training-cutoff data to more strictly avoid future leakage, and CLQT adds time-gated retrieval that the agent can call itself rather than be limited to curated inputs. PortBench spans six asset classes and scores each stage of the portfolio process, and OpenPM gives agents SEC filings across the S&P 500, with every record gated by the time it became available. Some benchmarks test neighboring tasks: Quant-Arena and AlphaForgeBench have models write strategy code instead of trading directly, TraderBench covers crypto and options trading, and OpenFinGym bundles trading with forecasting and other quantitative tasks. Live arenas such as DeepFund, Agent Market Arena, LiveTradeBench, AI-Trader, Alpha Arena, NextFund, and LiveMACE trade forward in time.
A few studies outside of benchmarks evaluate particular agent systems as stock pickers. Fatouros and Metaxas test the monthly recommendations of MarketSenseAI, a multi-agent system that includes a fundamentals agent, on 467 S&P 500 stocks at 19 monthly dates. Miyazaki et al. run a multi-agent team on a monthly long-short portfolio of TOPIX 100 stocks for 27 months after the model’s knowledge cutoff, with securities reports among its inputs. Crisóstomo and Mykhalyuk have four chat LLMs rank the 35 stocks of the IBEX-35 each month for ten months. Chen and Pu have an LLM with web search score every Russell 1000 stock daily and measure the alpha of the top-ranked stocks against the Fama-French five factors plus momentum.
Most of these benchmarks score returns against a passive baseline, adjusted for risk, and KTD-Fin, CLQT, and Crisóstomo and Mykhalyuk also report information ratios. However, most trade daily or intraday, which rewards short-horizon reactions to prices and news rather than valuation. The exceptions are CLQT, which trades bi-weekly in its backtest, PortBench, which rebalances monthly in its 2024 backtest and weekly in its stress periods, and the monthly evaluations of Fatouros and Metaxas, Miyazaki et al., and Crisóstomo and Mykhalyuk.
Furthermore, the live arenas are constructed over small universes and short windows. DeepFund trades five stocks over 24 trading days, Agent Market Arena two stocks and two cryptocurrencies over two months, LiveTradeBench 15 stocks and ETFs over 50 trading days, LiveMACE 23 assets over 30 days, and NextFund seven stocks per market over two quarterly windows. AI-Trader covers the Nasdaq-100, but for about five weeks. Hence they lack the statistical power to differentiate between skill and luck. The backtests with broader universes have other limits. OpenPM covers about 500 stocks, but over a single window of 44 trading days and without significance tests. FINSABER covers 2000 to 2024, a period the latest frontier models have already seen in training. CLQT pulls its roughly 72 stocks from the correlated S&P 100. For the latest frontier models, it thus offers too few independent bets following their training cutoff to separate skill from luck.
Few of these report uncertainty estimates. PortBench reports bootstrap intervals for some of its comparisons, and Miyazaki et al. run each configuration 50 times and test the differences between configurations. The closest precedent for our random-portfolio test (Appendix B.4) is Fatouros and Metaxas, who rank MarketSenseAI’s strong-buy picks against 10,000 random portfolios drawn from the same universe. The picks rank at the 99.7th percentile on the S&P 500. On the S&P 100, where the system selects about ten stocks a month, the result is not statistically significant. Work on mutual funds has long used bootstrap simulations to separate skill from luck (Kosowski et al., 2006; Fama and French, 2010). We found no existing benchmark that combines a broad cross-section of stocks, a trading cadence suited to valuation, a multi-month window after the training cutoff, and a test against luck. So overall, existing benchmarks are not sufficient to rigorously evaluate frontier agentic fundamental investing.
A.3 Look-ahead bias
A backtest is informative only if the participant cannot see the future, and a language model may have memorized the test period during training. Sarkar and Vafa show that pretrained models bring knowledge of later events into analyses meant to use only earlier information, and that prompting does not eliminate this. Lopez-Lira, Tang, and Zhu find that models can reproduce exact economic and financial values from before their knowledge cutoff, that neither instructions nor masking prevents this, and that no such recall appears after the cutoff. For trading agents, Profit Mirage reports that strong backtested returns drop sharply once the test period passes the model’s knowledge cutoff, and Look-Ahead-Bench measures the decay in alpha between an in-sample and an out-of-sample period. Not all results point the same way. Glasserman and Lin find that removing company names from news headlines improves in-sample performance, which they attribute to a distraction effect that outweighs look-ahead bias, and He et al. train models only on text available at each date and find look-ahead bias in news-based return prediction to be modest.
Benchmarks guard against this in two main ways. The first is to evaluate only after the model’s knowledge cutoff, as StockBench, Miyazaki et al., and the live arenas do. The second is to control what the participant can retrieve. FinDeepForecast, CLQT, and OpenPM restrict retrieval to records dated before each decision, and Hedge-Bench supplies a frozen set of documents. The date filters of search engines are not sufficient: El Lahib et al. find that for 71% of their questions, a date-restricted Google search returned at least one page with major post-cutoff information. Our benchmark does both (Appendix B.3).
Table A.1. Design features of recent benchmarks for financial agents.
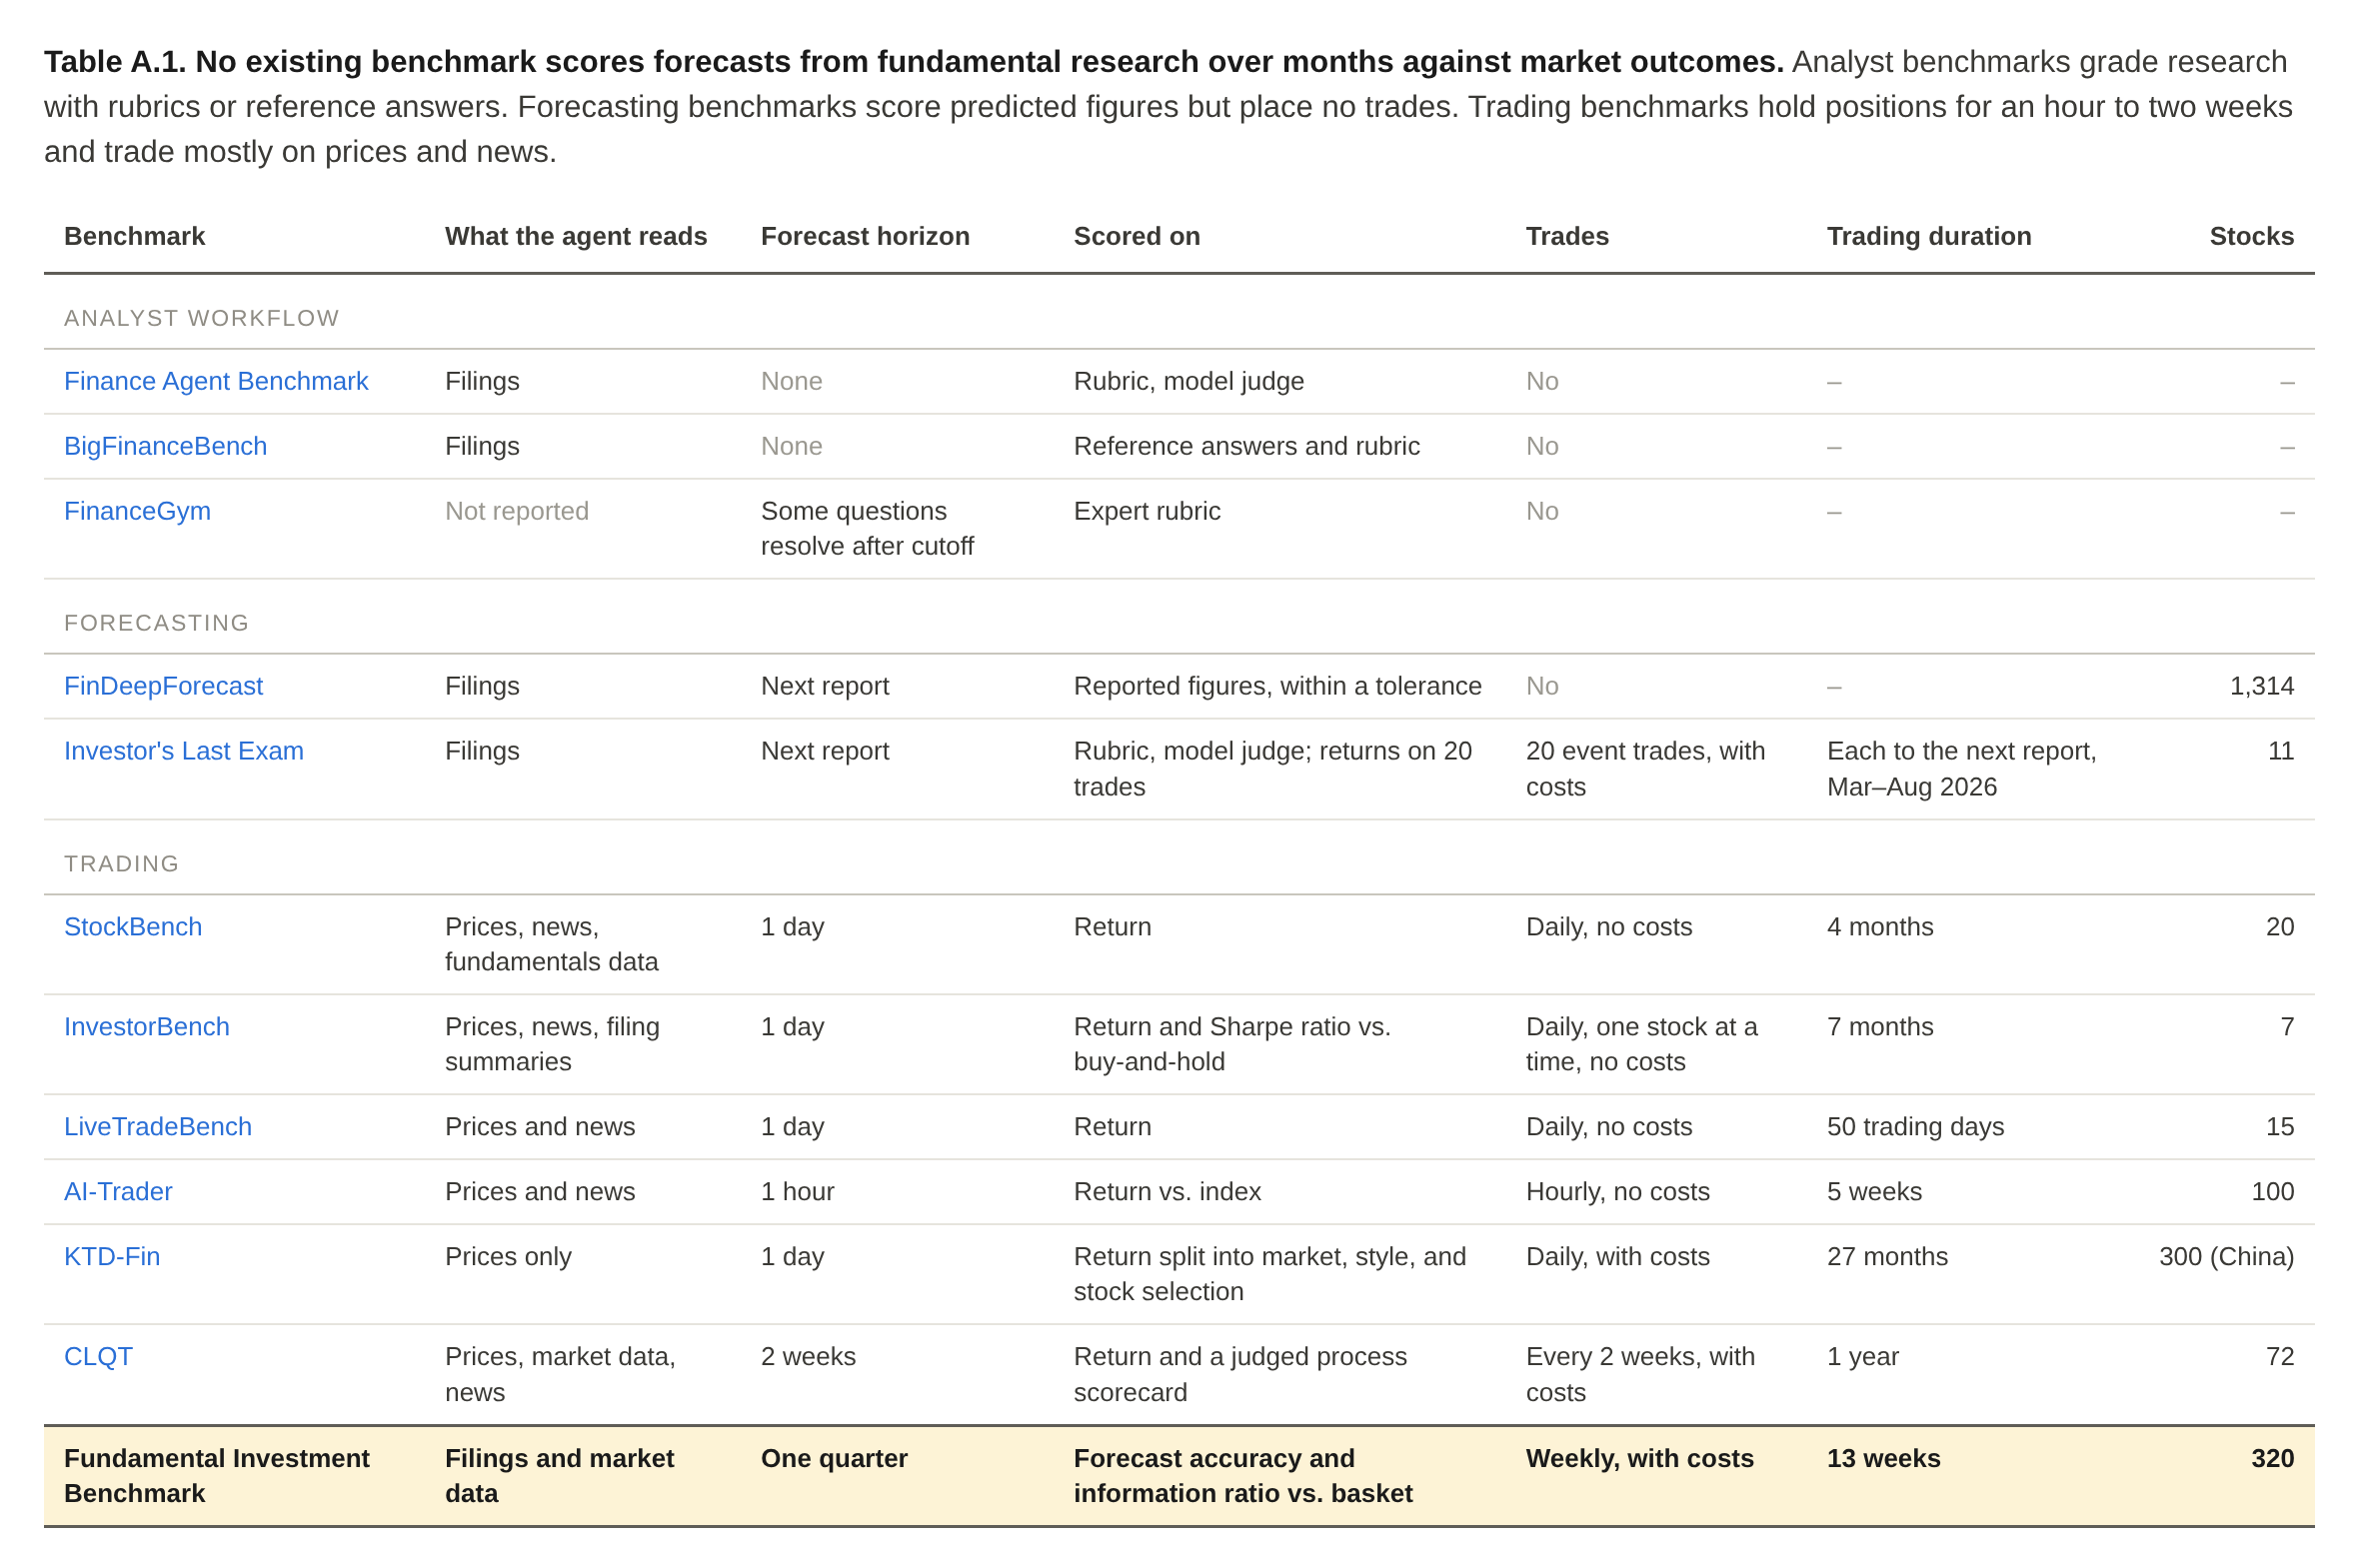
¹ StockBench (20 Dow stocks, daily), LiveTradeBench (15 large caps, daily), AI-Trader (Nasdaq-100, hourly), and Agent Market Arena (two stocks and two cryptocurrencies, daily), none with trading costs. KTD-Fin and CLQT charge costs but also trade from prices, market data, and news.
² Investor's Last Exam (rubric scored by a model judge), FinanceGym (expert rubrics), BigFinanceBench (reference answers and weighted rubrics), and the Finance Agent Benchmark (rubric scored by a model judge). FinDeepForecast also assigns the question but scores forecasts against outcomes.
B. Benchmark design
B.1 Scoring
Reward participants only for skillfully picking the right stocks.
Baseline: equal-weighted basket, chosen to assess the participant’s ability to select the right stocks. We score every participant’s sector portfolio against a portfolio holding equal dollar amounts of each stock in the sector: the equal-weighted basket. This is in contrast to standard sector indices which weight each company in proportion to its market cap. Against an equal-weighted basket, every stock matters equally, so a participant does well only by being right about many of them as opposed to just the largest few. The equal-weighted baskets rebalance weekly based on Monday market close prices, the same cadence at which the participants update their portfolios. We also intentionally choose the baseline to only be taken over stocks within the sector, as opposed to a market average like the S&P500, which would primarily measure sector performance relative to the rest of the market. Comparing the participant’s performance to an equal-weighted sector basket thus avoids crediting the participant for market- and sector-wide price movement.
Metric: information ratio, chosen to reward consistent leads over the baseline and select for skill over luck. We use the standard metric for assessing an actively managed portfolio’s performance: the information ratio. This is the portfolio’s return over the sector baseline, divided by how much that return fluctuates over time. See “Score calculation” below for its formula. Dividing by the fluctuation matters because raw return rewards large bets, including lucky ones: for example, a portfolio might earn high returns by concentrating its bets in a few stocks. Yet its lead over the equal-weighted basket would fluctuate more, meaning it was inconsistent in beating the baseline and may have come out above it in the end due to luck. Its information ratio would hence rank it lower, as desired.
Evaluating whether simple price factors explain the lead over the basket. A high information ratio alone does not prove that a participant valued the stock correctly, so we ask how much of the lead came from simple price factors. One such factor is beta: covariance of the portfolio with the market, divided by market variance. If a participant can score well by just choosing stocks that are less correlated with the market, without reading a single filing, then a high score no longer proves that it used good judgement about the company’s fundamental value. We therefore also report each information ratio after removing the lead explained by five such price factors: low beta, low volatility, past winners, past losers, and nearness to the 52-week high. Each is a well-documented pattern in which a stock's past price behavior alone has predicted its later return relative to its peers:
On each sector, we regress the participant's daily active return on the five factor portfolios’ returns, with an intercept, by ordinary least squares. The active return is its portfolio’s return minus the basket's, net of trading costs. The adjusted information ratio of a participant is the intercept divided by the standard deviation of the residuals, annualized and averaged over the 8 sectors.
Figure B.1
Price factors explain 50% to 75% of Sonnet’s lead and more than Luna’s
Each agent’s lead over the equal-weighted portfolios, split into the part each of five price factors explains and the part left unexplained. In parentheses, what each factor earned relative to the equal-weighted portfolios. All returns are after trading costs. Agents use Sonnet 5.5 or GPT-6 Luna (high effort) and make trades weekly from Jul 6 to Oct 2, 2026.

Across all Sonnet agent configurations, simple price factors account for 50% to 75% of excess returns above the baseline, whereas they account for more than the entire outperformance of the Luna systems. Low beta and low volatility contributed most heavily to these returns, outperforming the benchmark basket by 4.0 and 3.0 percentage points respectively during the evaluation period. Even after controlling for these price factors, Sonnet agents retained an unexplained lead of +0.3 to +0.6 percentage points (out of total excess returns of +1.2 to +1.5 percentage points), whereas Luna agent portfolios fell roughly 0.5 percentage points behind the equal-weighted baseline.
B.2 Trading setting parameters
Held views are rewarded and with correct accounting; not speed or churn. While our scoring is meant to ensure participants are rewarded only for skillfully selecting the right stocks to hold and short, a participant could still beat the baseline by trading fast or often. We design the benchmark to counter this. We also keep trading costs small and predictable for correct accounting of returns.
Cadence: weekly, chosen to give fundamental views time to play out. Participants decide their trades once a week, at 3 p.m. New York time on Monday, and their trades fill at that day’s closing price. Fundamental views take weeks or months to pay off, so daily decisions would add little independent evidence that the fundamental view is correct over time while rewarding fast reactions to news and costing five times as much to run. Meanwhile, monthly decisions would leave a participant unable to respond to an earnings report–which usually have a large impact on stock price–for up to four weeks. A weekly cadence strikes a good balance between letting the participant update when there is relevant new information while requiring them to make views that hold well over time.
Trading costs: accounted for to favor held fundamental views. Every trade is charged a cost. Without one, a participant that reshuffled its portfolio every week would look as good as one that held a few well-founded positions, and the benchmark could not tell them apart. We keep this charge realistic, covering the price gap between buying and selling, the broker’s fee, the price effect of the order, the borrowing fee, and a 5% cap on shorts. Fills pay a 5-basis-point half-spread, a 1-basis-point fee, and square-root market impact, 0.5 × daily volatility × √(shares ÷ average daily volume). Shorts pay 30 basis points a year to borrow.
Stocks to trade: large only, chosen to keep trading costs predictable for correct accounting. Each sector desk holds only large, heavily traded companies. Their shares can be bought and sold at almost the same price, and can reliably be borrowed for short positions at a known fee. For small companies these costs are higher and harder to estimate, so a simulation of trading them would be less trustworthy.
Portfolio size: $1 million, chosen to be too small to move the stock price to simplify accounting. Each sector desk manages $1 million. Buying a large amount of a stock pushes its price up, so a big portfolio earns less from the same idea than a small one. At $1 million with only large stocks being traded, orders are too small to move prices, and a participant’s return depends only on which stocks it chose. This allows us to do simple and correct accounting.
B.3 Information
The future cannot leak in. While we chose a realistic setting for scoring the ability of the participants to do fundamental investing, a participant could also score well by already knowing what happened. We take the following measures to prevent this.
Benchmark time period: chosen to prevent future leakage from the model’s knowledge. A language model is trained on text up to a fixed date, its training cutoff. It is capable of memorizing this text it was trained with, which can include information relevant to stock prices. Each participant therefore begins trading the week after the cutoff of the newest model it uses so that the model’s knowledge cannot be a source of future information. For the models we used, the latest cutoff is June 30, so we begin trading on July 2. Testing every model on one fixed historical window would be simpler, but only older, weaker models could enter it, rather than the most capable frontier models we wish to assess.
Point-in-time search proxy: used to prevent future leakage from the internet. We provide each participant access to anything publicly available on the internet so that it can do research in a realistic, unconstrained setting in our benchmark. To prevent the participant from getting information about what happens to a stock after its weekly trading decision date, all research goes through a search service that returns only what was available before each decision deadline. See “Point-in-time enforcement” below for implementation details and our verification that there is no future leakage through this method.
Point-in-time enforcement. Each analyst run carries a signed token that fixes its cutoff, and the run will not start unless the proxy confirms it. Filings from the three days before the cutoff stay hidden unless their acceptance time can be confirmed, and EDGAR's full-text search and cumulative financial data, which carry later figures, are blocked. Codex ran in a container whose only network route was the proxy. After each run, an audit checks every cited source against the proxy's log. Orders fill only at the close after the decision; all 552 July fills did, from a price file checksummed before the first run.
B.4 Breadth
Trade 320 stocks at once, to make up for a short run. A participant can begin trading only after its model’s training cutoff, so a run lasts about three months. On a single sector desk, that is too short to separate skill from luck, which we show. To that end, we built portfolios by picking stocks at random and scored them the same way the benchmark scores participants. On one desk of 40 stocks, nearly one in three earned an information ratio above 1.0 (Figure B.2), an exceptional level that few professional managers sustain (Grinold and Kahn, 2000) (higher is better).
Eight sector desks: traded at once, so that luck averages out across desks instead of over time. Since we cannot lengthen the run to resolve this issue, each participant trades eight desks at once, and its score is the average of the eight information ratios. Because the information ratio on each desk is computed from the portfolio’s return minus its equal-weighted basket’s (B.1), anything that moves a whole sector, or several sectors at once, appears in both and cancels. What remains is the choice of stocks within each sector. A random portfolio that gets lucky with these choices on one desk rarely gets lucky on the others, resulting in it being difficult to attain a high information ratio across multiple sectors by chance.
Random portfolios: used to check that eight desks reduce scoring highly by luck as much as a longer run would. Using our random portfolios, we do see it is difficult to attain a good information ratio by luck across eight sectors. On the real prices of the 320 stocks, the scores of random portfolios were 2.8 times less spread out on eight desks than on one, the same narrowing that a run eight times as long would give. Only about one in twenty scored above 1.0, significantly down from one in three (Figure B.2).
Figure B.2
Random portfolios often score above 1.0 on one sector, rarely across eight
Information ratios of 1,000,000 random portfolios per sector relative to the equal-weighted portfolios, on one sector and averaged across eight. Each random portfolio holds ten of its sector’s 40 stocks in equal amounts, rebalanced weekly. The dotted line marks an information ratio of 1.0. All returns are after trading costs. Prices from Jul 6 to Oct 12, 2026.

We found the same narrowing in each of the four preceding quarters, as shown in Figure B.3.
Figure B.3
Across eight sectors, random portfolios rarely beat 1.0 in any quarter
Share of random portfolios with an information ratio above 1.0, on one sector and averaged across eight, in this run and the four quarters before it. Each random portfolio holds ten of its sector’s 40 stocks in equal amounts, rebalanced weekly. Earlier quarters leave out stocks not yet listed, so they cover 311 to 316 of the 320 stocks. All returns are after trading costs.

Hence over our eight sector desks, it is very unlikely that a benchmark participant would achieve an information score considered high by sheer luck.
C. Agent participants
C.1 Experimental setup
We ran two models, Claude Sonnet 5.5 and OpenAI's GPT-6 Luna, in three agent setups on 8 sectors of 40 stocks each from July 6 through October 2 of 2026. These setups are listed in Table C.1.
Table C.1.
| Participant | Orchestration |
|---|---|
| Shortcut | Multi-agent: one “portfolio manager” agent per sector, one “analyst” agent for each of the 40 stocks in a sector |
| Codex | |
| Codex, single-agent | Single-agent: One agent responsible for researching and investing for each sector. |
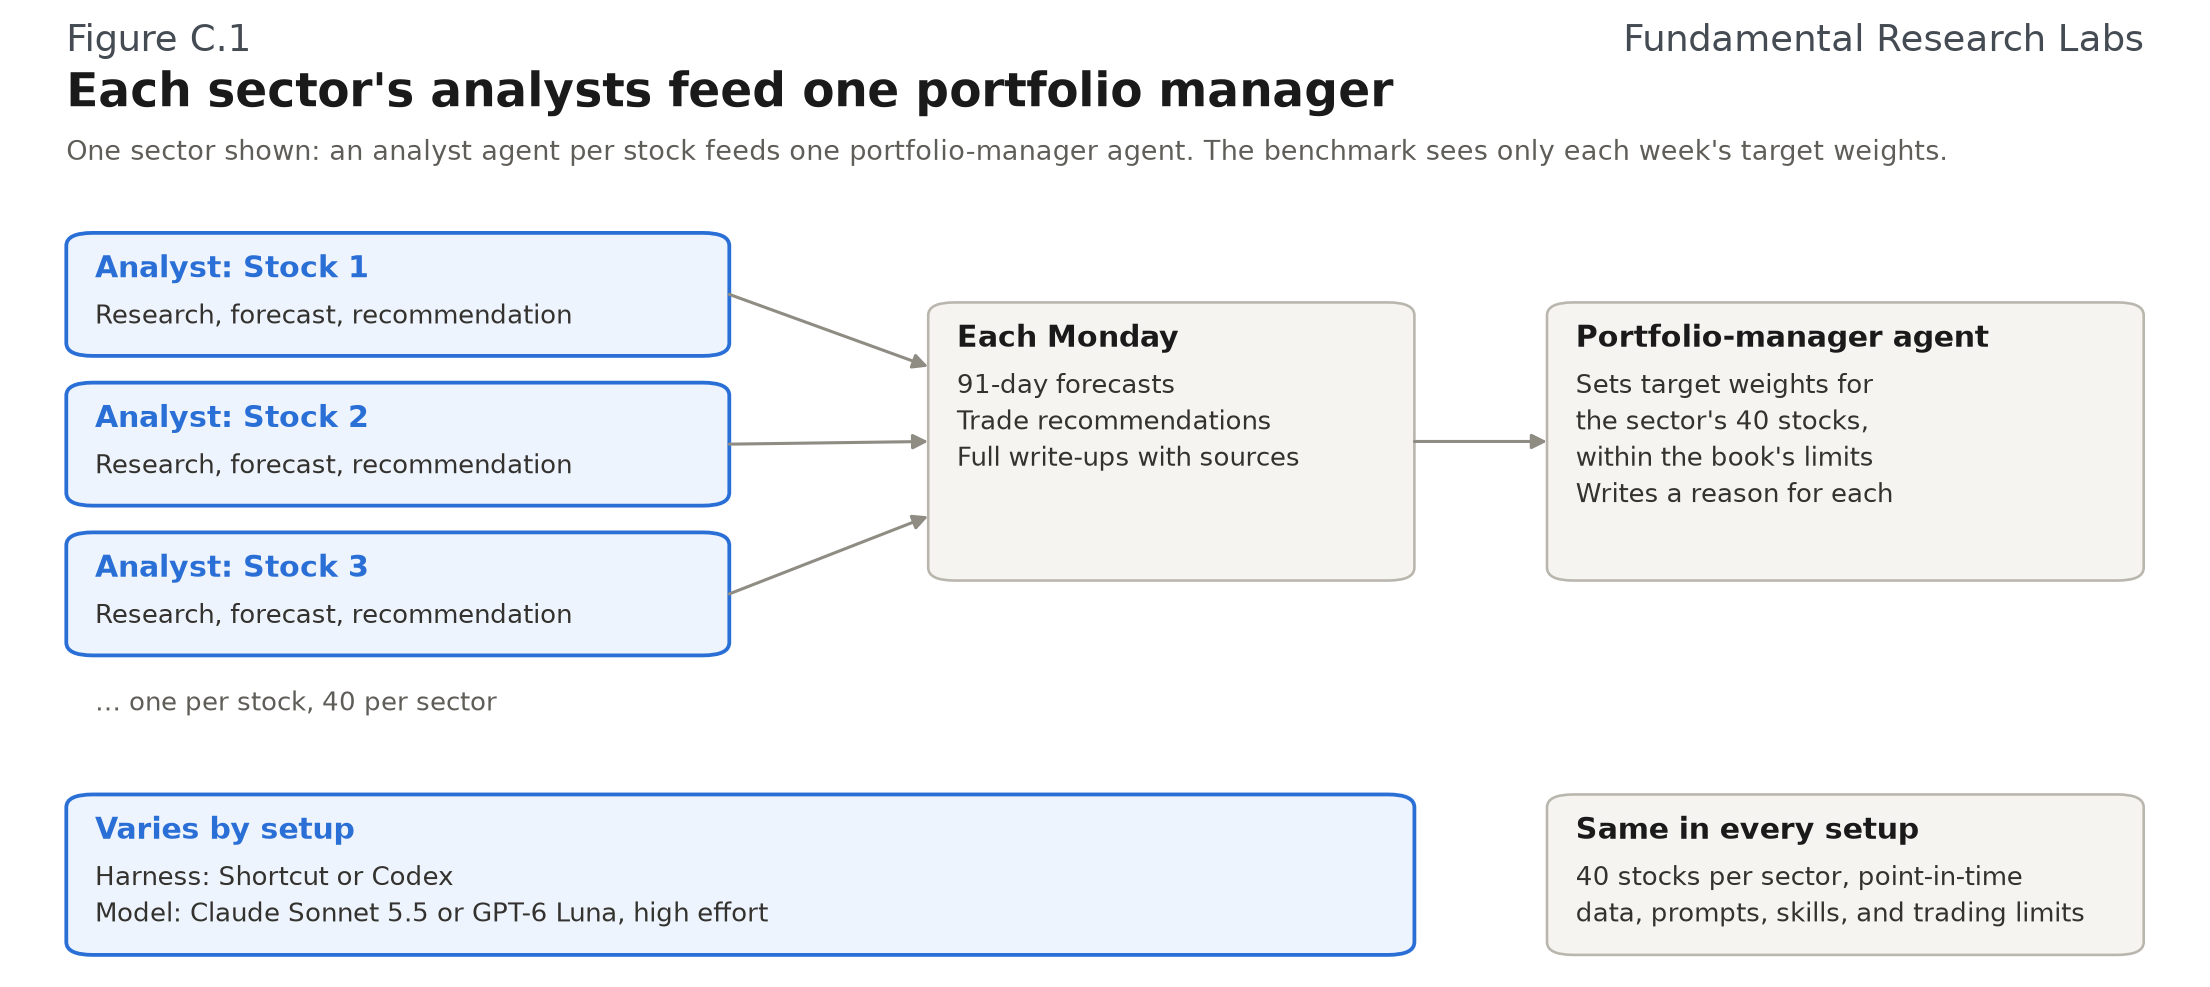
For the multi-agent orchestrations, as shown in Figure C.1, each sector is initialized with one “analyst” agent per stock. The analyst agents are instructed to research its assigned company, forecast its returns relative to its sector over the next quarter (91 days), and recommend a trade. After all analyst agents finish their week’s run, a “portfolio manager” agent reviews the writeups and forecasts of each analyst agent and submits trades to our paper trading portfolio API to be executed at market close.
For the Codex single-agent ablation, we ask one agent to invest based on the fundamentals of the businesses in its sector. It is given the same data and portfolio API and runs every Monday on the same cadence as the multi-agent participants.
D. Limitations and future work
Our benchmark evaluates performance on a fixed quarter (July 6 through October 2 2026), a duration too short to establish generalization across market regimes. The 8 sectors we chose are not a representative sample of the entire market, and we limited the sectors to the largest 40 stocks by market cap. Future versions of the benchmark could run over longer durations with more sectors to strengthen statistical significance.
We chose Codex as our generic agent harness since it is one of the most widely-used open source agent harnesses. However, choosing Codex may have biased our results in favor of Luna because Luna likely had more training in the Codex harness than Sonnet did. Despite both agent harnesses receiving identical prompts, Sonnet used 9% fewer searches per initial analysis and 21% fewer searches per weekly update switching from Shortcut to Codex while Luna’s increased by 32% and 17% respectively. Future versions should compare a generic agent harness not affiliated with OpenAI/Anthropic to avoid biasing generic harness results.
References
- Atkins, A., and Kirakosian, M. (2026). New Hedge Funds Are Using AI Bots to Rival Industry Giants. Bloomberg News, June 24, 2026.
- Benhenda, M. (2026). Look-Ahead-Bench: a Standardized Benchmark of Look-ahead Bias in Point-in-Time LLMs for Finance. arXiv:2601.13770.
- Bigeard, A., Nashold, L., Krishnan, R., and Wu, S. (2025). Finance Agent Benchmark: Benchmarking LLMs on Real-world Financial Research Tasks. arXiv:2508.00828.
- Cai, X., et al. (2026). OpenPM: Auditable Point-in-Time Evaluation for LLM Portfolio-Management Agents. arXiv:2608.09988.
- Chen, Z., et al. (2021). FinQA: A Dataset of Numerical Reasoning over Financial Data. In Proceedings of the 2021 Conference on Empirical Methods in Natural Language Processing, 3697–3711.
- Chen, Y., et al. (2025). StockBench: Can LLM Agents Trade Stocks Profitably In Real-world Markets? arXiv:2510.02209.
- Chen, Z., and Pu, D. (2026). Autonomous Market Intelligence: Agentic AI Nowcasting Predicts Stock Returns. arXiv:2601.11958.
- Crisóstomo, R., and Mykhalyuk, D. (2026). Large Language Models and Stock Investing: Is the Human Factor Required? arXiv:2603.19944.
- El Lahib, A., Xia, Y.-J., Li, Z., Wang, Y., and Pi, X. (2026). Temporal Leakage in Search-Engine Date-Filtered Web Retrieval: A Retrospective Forecasting Case Study. arXiv:2602.00758.
- Fama, E. F., and French, K. R. (2010). Luck versus Skill in the Cross-Section of Mutual Fund Returns. The Journal of Finance 65(5), 1915–1947.
- Fan, T., et al. (2025). AI-Trader: Benchmarking Autonomous Agents in Real-Time Financial Markets. arXiv:2512.10971.
- Fatouros, G., and Metaxas, K. (2026). Signal or Noise in Multi-Agent LLM-based Stock Recommendations? arXiv:2604.17327.
- Glasserman, P., and Lin, C. (2023). Assessing Look-Ahead Bias in Stock Return Predictions Generated By GPT Sentiment Analysis. arXiv:2309.17322.
- Grinold, R. C., and Kahn, R. N. (2000). Active Portfolio Management: A Quantitative Approach for Producing Superior Returns and Controlling Risk, 2nd ed. McGraw-Hill.
- Haque, M., et al. (2026). Deep FinResearch Bench: Evaluating AI’s Ability to Conduct Professional Financial Investment Research. arXiv:2604.21006.
- He, S., Lv, L., Manela, A., and Wu, J. (2025). Chronologically Consistent Large Language Models. arXiv:2502.21206.
- HFR (2026). Hedge Fund Industry Assets Hold at Record Level Through Rates, Tech Volatility. HFR Global Hedge Fund Industry Report, October 22, 2026.
- Hu, L., et al. (2025). FinSearchComp: Towards a Realistic, Expert-Level Evaluation of Financial Search and Reasoning. arXiv:2509.13160.
- IB-bench.
- Investment Company Institute (2026). Active and Index Investing, September 2026. October 30, 2026.
- Islam, P., et al. (2023). FinanceBench: A New Benchmark for Financial Question Answering. arXiv:2311.11944.
- Jiang, H., et al. (2026). Investor’s Last Exam: Can AI Agents Do Equity Investment Without Seeing the Future? arXiv:2610.38342.
- Karger, E., et al. (2024). ForecastBench: A Dynamic Benchmark of AI Forecasting Capabilities. arXiv:2409.19839.
- Kim, A., Muhn, M., and Nikolaev, V. (2024). Financial Statement Analysis with Large Language Models. Working paper, since withdrawn by the authors.
- Kosowski, R., Timmermann, A., Wermers, R., and White, H. (2006). Can Mutual Fund “Stars” Really Pick Stocks? New Evidence from a Bootstrap Analysis. The Journal of Finance 61(6), 2551–2595.
- Krumdick, M., et al. (2026). FrontierFinance: A Long-Horizon Computer-Use Benchmark of Real-World Financial Tasks. arXiv:2604.05912.
- Lau, E., et al. (2026). BankerToolBench: Evaluating AI Agents in End-to-End Investment Banking Workflows. arXiv:2604.11304.
- Li, H., et al. (2024). INVESTORBENCH: A Benchmark for Financial Decision-Making Tasks with LLM-based Agent. arXiv:2412.18174.
- Li, W. W., Kim, H., Cucuringu, M., and Ma, T. (2025). Can LLM-based Financial Investing Strategies Outperform the Market in Long Run? arXiv:2505.07078.
- Li, C., et al. (2025). Time Travel is Cheating: Going Live with DeepFund for Real-Time Fund Investment Benchmarking. arXiv:2505.11065.
- Li, X., Zeng, Y., Xing, X., Xu, J., and Xu, X. (2025). Profit Mirage: Revisiting Information Leakage in LLM-based Financial Agents. arXiv:2510.07920.
- Li, X., et al. (2026). FinDeepForecast: A Live Multi-Agent System for Benchmarking Deep Research Agents in Financial Forecasting. arXiv:2601.05039.
- Li, C., Ma, P., Duan, Q., Lin, Z., and Wu, P. (2026). NextFund: A Unified Performance Tracking Platform for Agentic Portfolio Management. arXiv:2607.11141.
- Liang, B., et al. (2025). PriceSeer: Evaluating Large Language Models in Real-Time Stock Prediction. arXiv:2601.06088.
- Lopez-Lira, A., and Tang, Y. (2023). Can ChatGPT Forecast Stock Price Movements? Return Predictability and Large Language Models. arXiv:2304.07619.
- Lopez-Lira, A., Tang, Y., and Zhu, M. (2025). The Memorization Problem: Can We Trust LLMs’ Economic Forecasts? arXiv:2504.14765.
- Lu, J., et al. (2026). One Analyst Is Not Ground Truth: Grading Agent-Built Financial Models Against Observed Professional Practice. arXiv:2607.24889.
- Mercer (2026). AI is boosting asset managers’ investment operations, but humans still call the shots, according to a new Mercer report. May 21, 2026.
- Miyazaki, K., Kawahara, T., Roberts, S., and Zohren, S. (2026). Toward Expert Investment Teams: A Multi-Agent LLM System with Fine-Grained Trading Tasks. arXiv:2602.23330.
- Nof1 (2025). Alpha Arena.
- Opalesque (2026).
- Papasotiriou, K., Sood, S., Reynolds, S., and Balch, T. (2024). AI in Investment Analysis: LLMs for Equity Stock Ratings. arXiv:2411.00856.
- Qian, L., et al. (2025). When Agents Trade: Live Multi-Market Trading Benchmark for LLM Agents. arXiv:2510.11695.
- Qian, H., et al. (2026). Quant-Arena: Benchmarking LLM Agents for Quantitative Trading Research. arXiv:2610.30113.
- Qu, B., and Chen, M. (2026). CLQT: A Closed-Loop, Cost-Aware, Strategy-Consistent Benchmark for Diagnostic Evaluation of LLM Portfolio-Management Agents. arXiv:2606.29771.
- Ramesh, M., Cho, E., Lu, A., Huang, S., and Lyu, B. (2026). Hedge-Bench: Can Agents Reason Their Way to Better Predictions? arXiv:2606.03918.
- Sarkar, S. K., and Vafa, K. (2024). Lookahead Bias in Pretrained Language Models. NBER conference paper.
- Sullivan, R., Timmermann, A., and White, H. (1999). Data-Snooping, Technical Trading Rule Performance, and the Bootstrap. The Journal of Finance 54(5), 1647–1691.
- Wang, A., et al. (2026). BigFinanceBench: A Workflow-Grounded Benchmark for Financial-Research Agents. arXiv:2606.03829.
- Xiao, Y., et al. (2026). FinanceHarness: Autonomous Financial Deep Research Framework. arXiv:2607.27853.
- Yang, Q., et al. (2025). LLM-as-a-Prophet: Understanding Predictive Intelligence with Prophet Arena. arXiv:2510.17638.
- Yu, H., Li, F., and You, J. (2025). LiveTradeBench: Seeking Real-World Alpha with Large Language Models. arXiv:2511.03628.
- Yuan, X., Xu, H., Xu, S., Zou, C., and Xiong, J. (2026). TraderBench: How Robust Are AI Agents in Adversarial Capital Markets? arXiv:2603.00285.
- Zeng, Z., et al. (2025). FutureX: An Advanced Live Benchmark for LLM Agents in Future Prediction. arXiv:2508.11987.
- Zhang, Y., et al. (2026). FrontierFinance: A Challenging Benchmark for Measuring Frontier Intelligence of Finance Agents. arXiv:2608.11683.
- Zhang, W., et al. (2026). AlphaForgeBench: Benchmarking End-to-End Trading Strategy Design with Large Language Models. arXiv:2602.18481.
- Zhang, K., et al. (2026). OpenFinGym: A Verifiable Multi-Task Gym Environment for Evaluating Quant Agents. arXiv:2606.26350.
- Zhao, Y., Chen, S., and Su, N. (2026). PortBench: A Correlation-Aware, Full-Pipeline Benchmark for LLM-Driven Portfolio Management. arXiv:2605.27887.
- Zhao, J., et al. (2026). LiveMACE: Process-Aware Evaluation of LLM Agent Capabilities in Evolving Markets. arXiv:2610.09872.
- Zhu, F., et al. (2021). TAT-QA: A Question Answering Benchmark on a Hybrid of Tabular and Textual Content in Finance. In Proceedings of the 59th Annual Meeting of the Association for Computational Linguistics, 3277–3287.
- Zhu, F., et al. (2025). FinDeepResearch: Evaluating Deep Research Agents in Rigorous Financial Analysis. arXiv:2510.13936.
- Zhu, T., et al. (2026). From Knowing to Doing: A Memory-Controlled Benchmark for LLM Trading Agents on Stock Markets. arXiv:2605.28359.
Cite as
Liu, J., Marks, S., and Yang, R. (2026). Catalyst Bench: Can AI agents generate fundamental alpha? Fundamental Research Labs. https://fundamentalresearchlabs.com/research/catalyst-bench
@misc{liu2026catalyst,
  title = {Catalyst Bench: Can AI agents generate fundamental alpha?},
  author = {Liu, Jeffrey and Marks, Samantha and Yang, Robert},
  year = {2026},
  month = nov,
  publisher = {Fundamental Research Labs},
  url = {https://fundamentalresearchlabs.com/research/catalyst-bench}
}